|
Employee/Business Review |
|
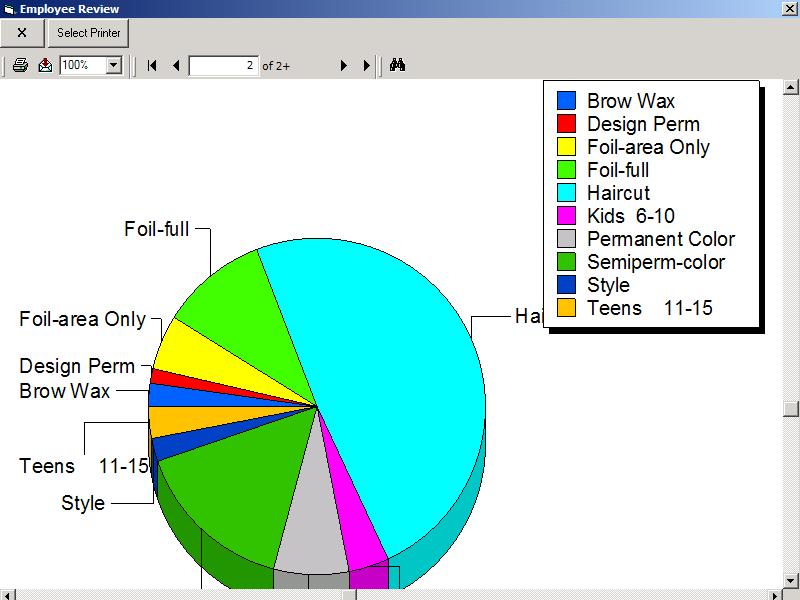
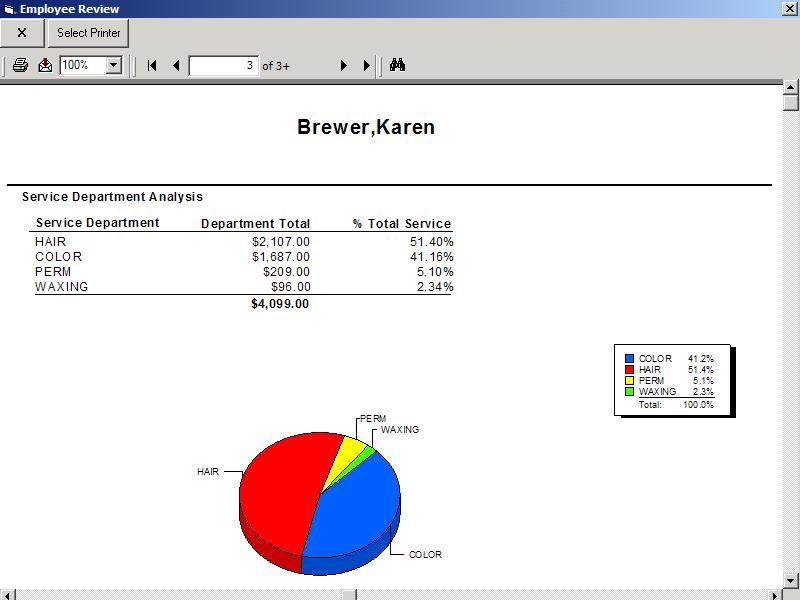
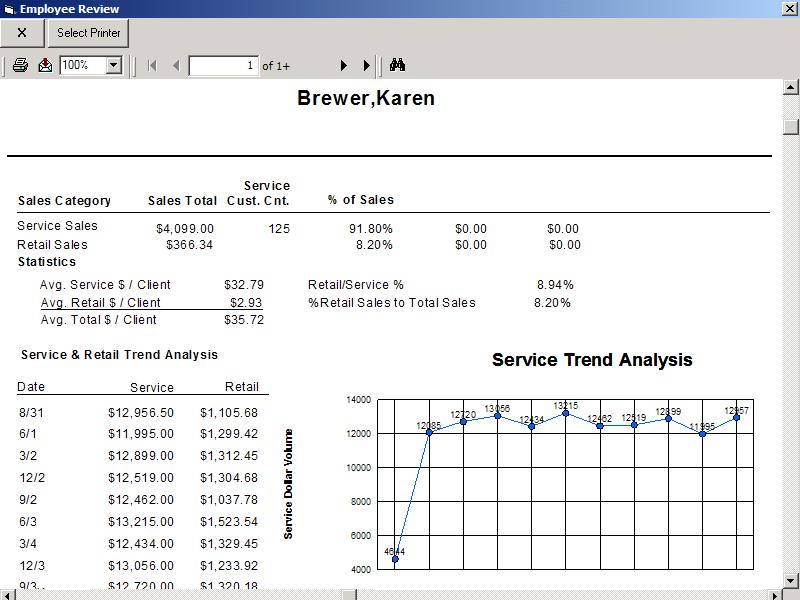
Important statistics such as Average Service $ / Client, Average Retail $ / Client, Retail / Service % and Percent of Retail to Total Sales are shown in the reports. The report shows the trends based upon weekly, monthly, quarterly, bi-annual or yearly. The trend graph shows growth or decline in sales. It is recommended to look at the quarterly trends to show true trends. Bi-annual and annual allow for a long history. Services are broken down by dollar amount showing the percentage of total service sales and sales by department. A sample report is shown below. |

