What If
Ever wonder what would happen if you could increase your average ticket by $5 per visit? How about what effect 10 more new customers a month would have on your bottom line? The What If Report answers these questions and many more.
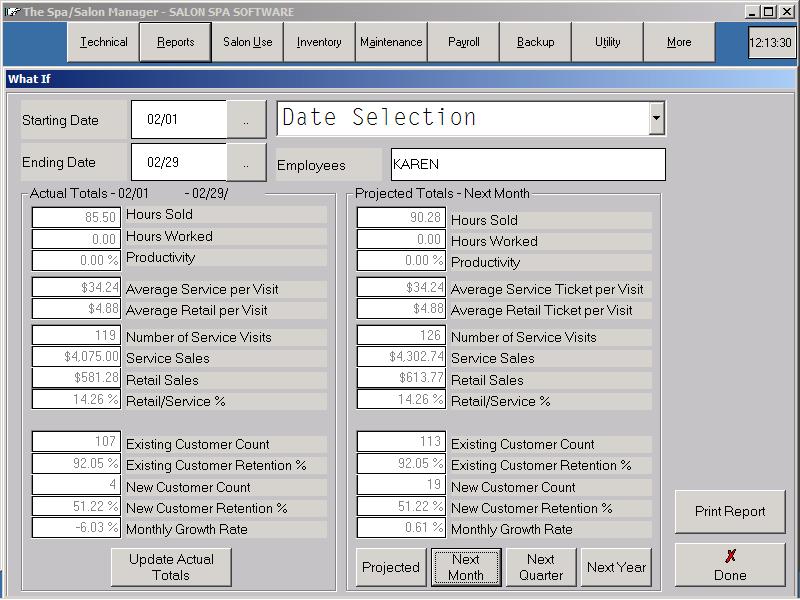
To use the What If Report you start by selecting dates for the report either by manually filling in the Starting Date and Ending Date or by selecting a date range from the box on the right. Then you can either do a report for the entire salon or focus on one specific employee. Finally you click the Update Actual Totals button at the bottom.
Once the program finishes collecting the information it shows a new section on the right side of the screen for your projected totals. You can change any of the boxes that aren't grayed out and see what effect that has on the current time frame. Many of the boxes are related to one another - for example, changing the Hours Worked will also change the Hours Sold to maintain the same Productivity. You can get details about these relationships by holding the mouse over the caption in the Projected Totals section.
The first three sections of numbers are used to project what your service and retail sales would have been during the same time period as the Actual Totals. Ultimately what determines your Projected Service Sales and Projected Retails Sales are your Number of Service Visits, your Average Service per Visit, and your Average Retail per Visit but changing the Hours Sold, Hours Worked, and Productivity also affects your projected sales since they all end up changing the Number of Service Visits.
The final section doesn't effect the current period's Projected Totals - instead they determine your potential for growth in the future. Changing the number of existing and new customers as well as the retention rates for those customers changes the Monthly Growth Rate. This rate can show growth (positive numbers) if you're bringing in and keeping enough new customers to replace the existing customers you're losing and it can also show decline (negative numbers) if the new customers being kept aren't enough to replace the existing customers being lost.
Once you've filled in your numbers for the projections you can see what effect they would have on the future by clicking the Next Month, Next Quarter, and Next Year buttons. If you'd like to make more changes to your projections you can click back on the Projected button and make more changes. This allows you to experiment with different numbers and find targets that allow you to grow your business.
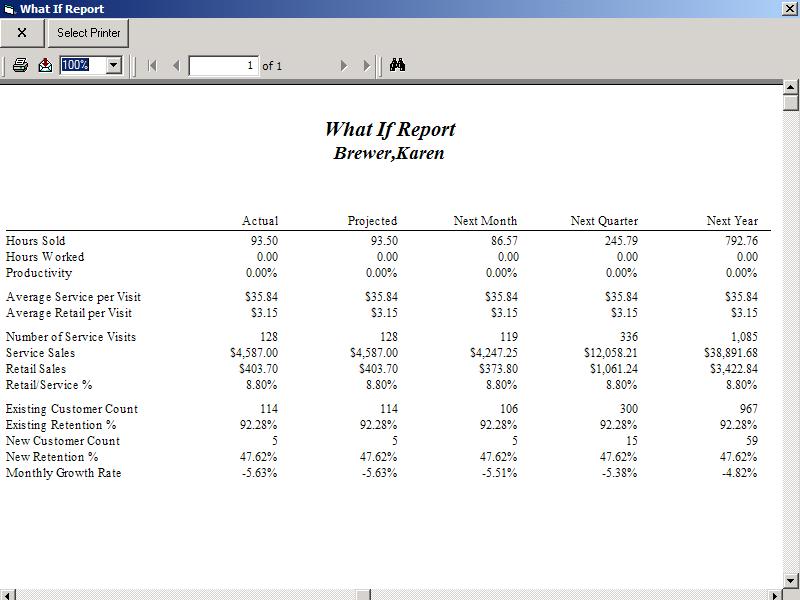
Finally you can print out all of the information - the actual totals, projected totals, next month, next quarter, and next year - using the Print Reports button.